
Summary
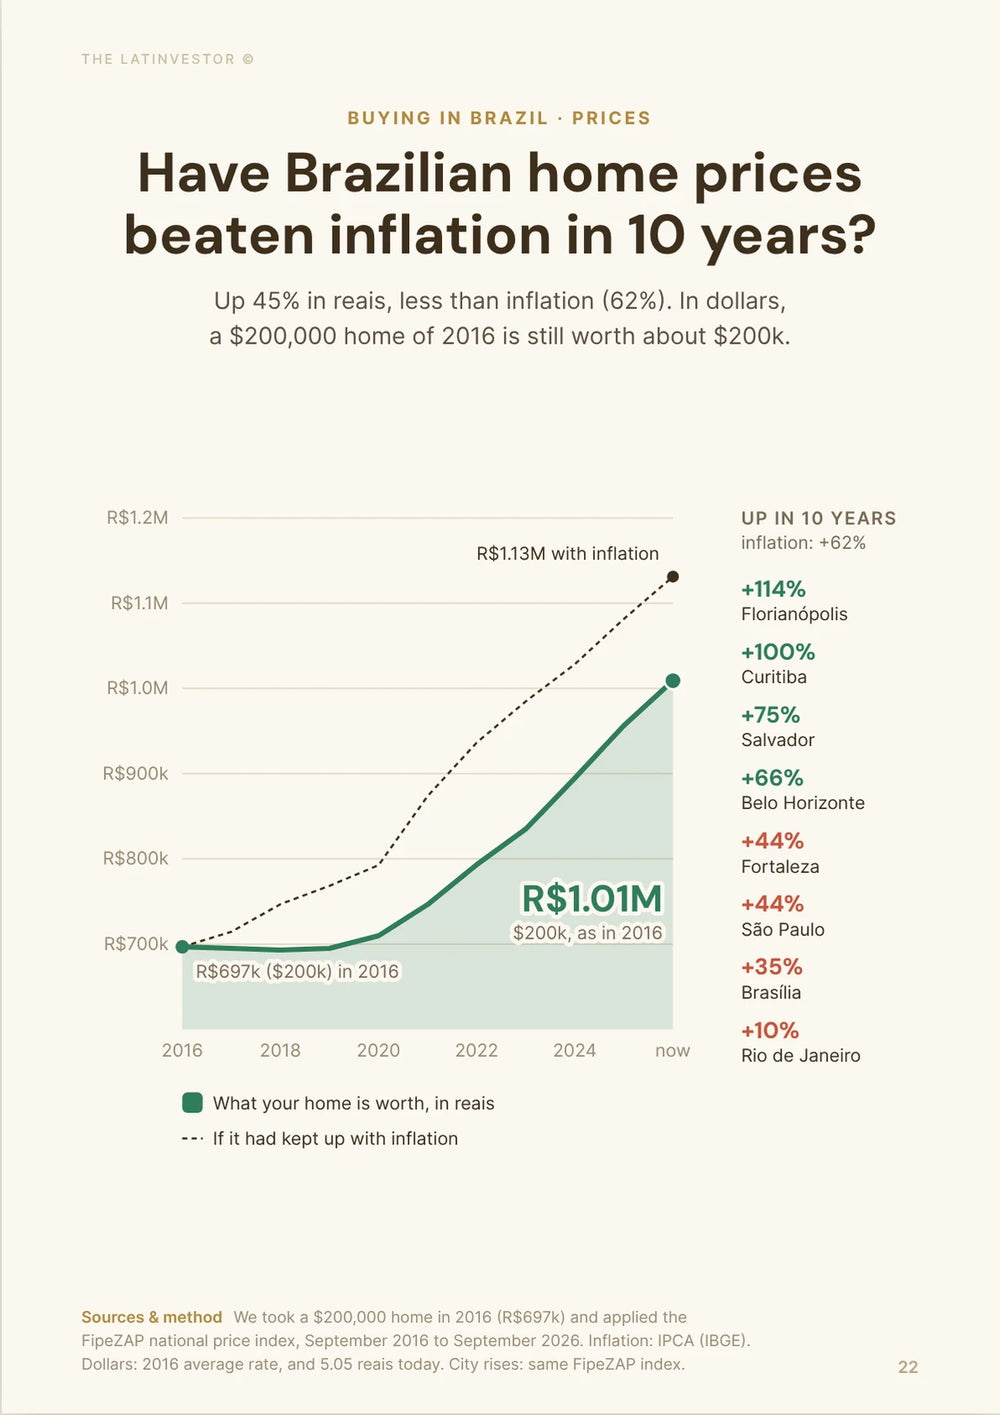
São Paulo home prices are going up, but slowly: FipeZAP asking prices rose 3.64% in the year to September 2026, to R$12,206 per square meter (about $2,420). After inflation, that's flat to slightly negative.
Asking prices and closed deals both point the same way. City ITBI records showed buyers paying about 3.3% more per square meter in June 2026 than a year earlier.
Prices rose 0.52% in September and 2.60% since January, so there's no sign of a citywide fall.
Against national inflation (IPCA, 4.58% over 12 months), the 3.64% rise is a real loss of about 0.9%. Against São Paulo's own IPC-Fipe (3.60% to July), it's a wash.
The market has lost steam: growth went from 6.56% in 2024 to 4.56% in 2025 and 3.64% now, well below the 5.51% average of the 56 FipeZAP cities.
The average hides big gaps. Jardins is up 6.7% and Moema 5.0%, while Pinheiros (-0.3%) and Vila Mariana (+0.4%) are flat.
Developers are building more than they sell: 154,769 new units launched in the 12 months to August 2026, against 121,064 sold. Unsold new stock reached 98,018 units, up 50.7% in a year.
Minha Casa, Minha Vida carries the new-build market: 71% of new-home sales in August 2026. Mid- and high-end projects now have about 13 months of stock, against 7 in 2024.
That's where buyers have leverage today: on unsold mid- and high-end new apartments, a 10% to 15% discount is a realistic target.
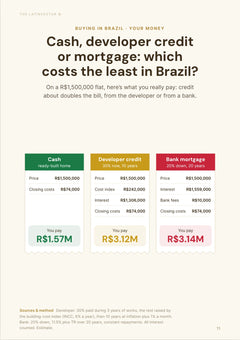
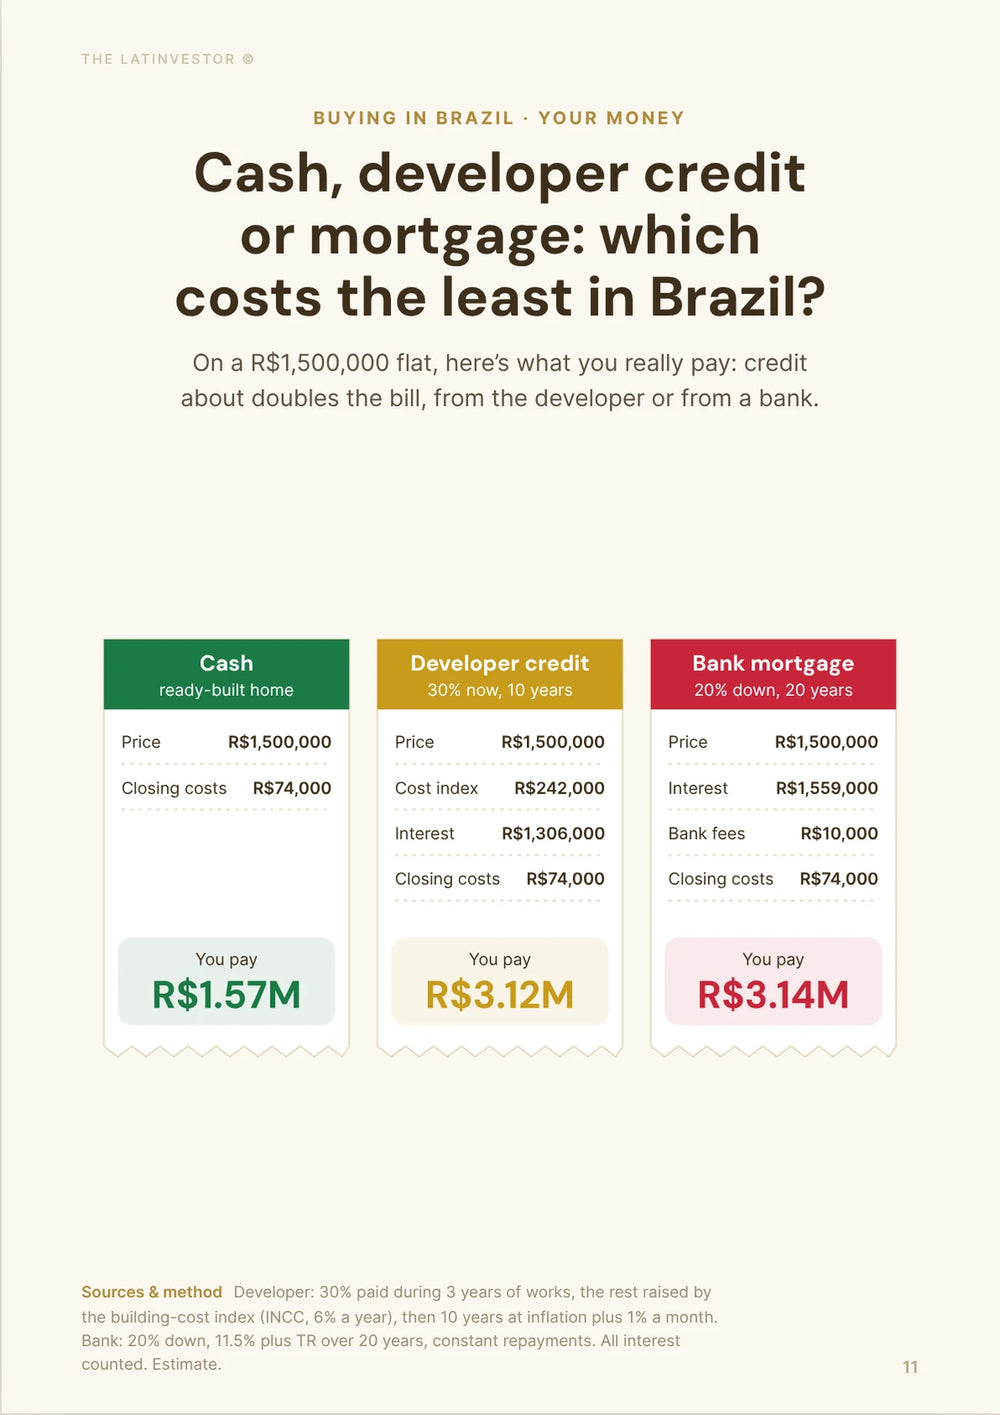
Mortgages still cap prices: about 7.98% plus TR at Caixa and close to 12% at the big private banks in September 2026.
Rents are rising faster than prices: +6.22% over 12 months, to R$65.78 per square meter a month, which keeps demand for housing strong.
The Selic came down from 15% to 13.75%, but that isn't cheap credit yet. A real price jump needs mortgages several points cheaper.
Bottom line: São Paulo prices are inching up in reais and standing still after inflation. Pick the neighborhood carefully and negotiate, especially on new builds.


Why can two people look at São Paulo home prices and reach opposite conclusions?
Because asking prices are rising, while closed sales and inflation make that rise look much smaller.
The cleanest headline comes from FipeZAP. Its September 2026 sale index puts the average advertised price in São Paulo at R$12,206 per square meter (about $2,420), 3.64% higher than a year earlier.
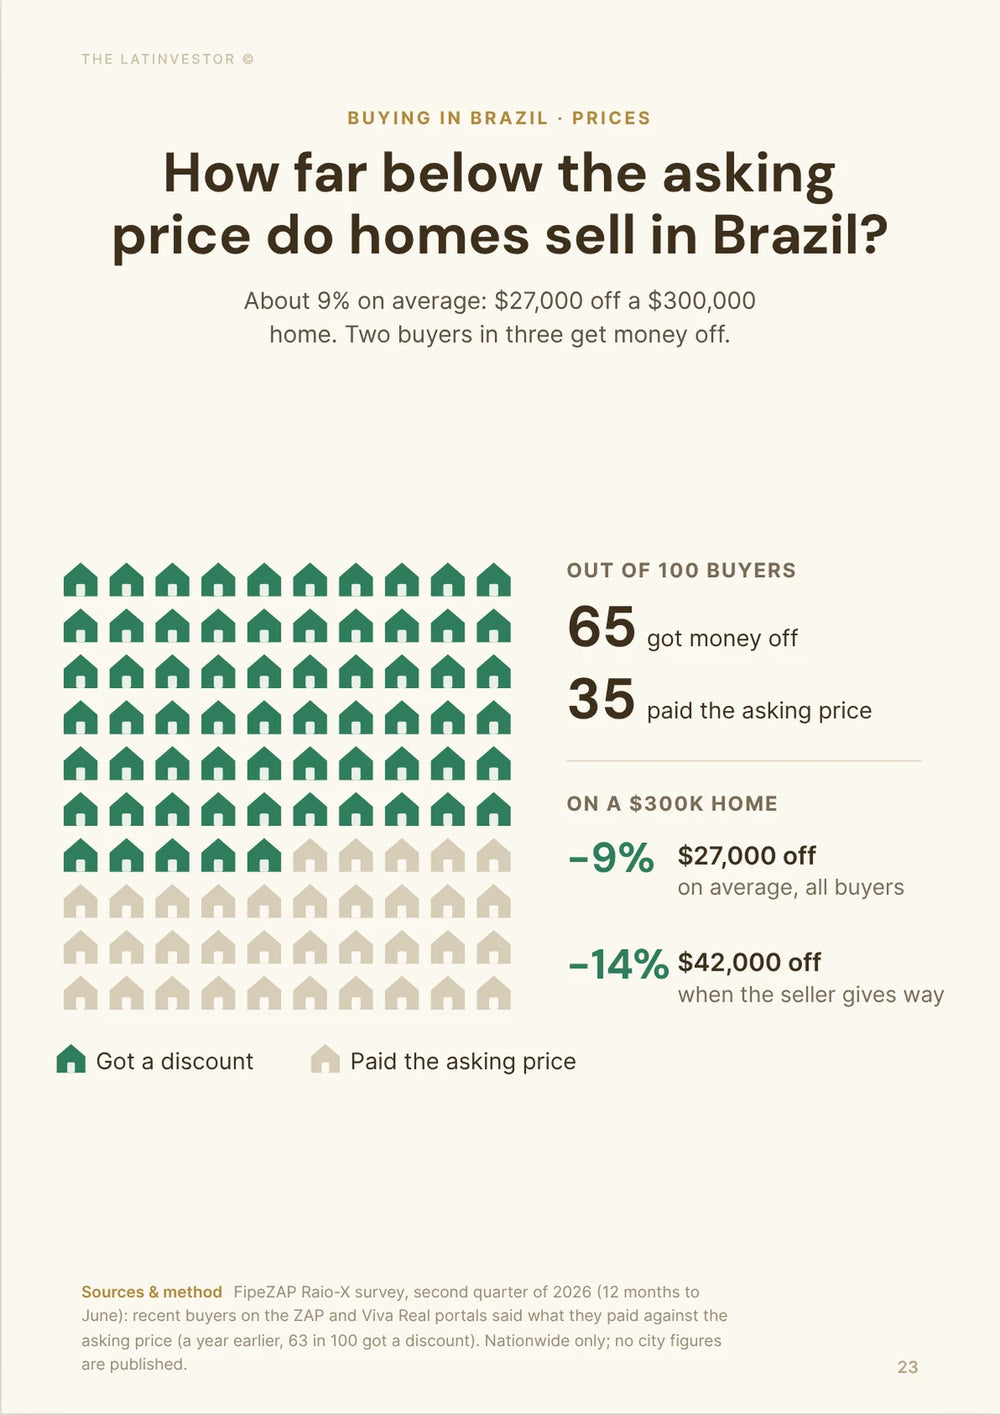
But FipeZAP tracks apartments advertised online, so it shows what sellers ask, not what buyers pay. An analysis of the city's ITBI transfer records by Flow Imóveis found that the median price paid per square meter for apartments was up about 3.3% year on year in June 2026. FipeZAP's own buyer survey adds that the average purchase closed 9% below the asking price in the second quarter of 2026.
Inflation adds another layer. The same 3.64% rise is a small loss against national inflation (IPCA, 4.58%), and roughly break-even against São Paulo's own IPC-Fipe index.
So when one person says prices are rising and another says they're flat, they're usually measuring different things.
| Measure | What it actually tracks | Recent direction | Best way to read it |
|---|---|---|---|
| FipeZAP São Paulo | Online asking prices for apartments | +3.64% over 12 months (Sept. 2026) | Sellers are asking more |
| São Paulo ITBI apartment data | Prices declared in completed transfers | +3.3% per m² (June 2026 vs June 2025) | Closed deals are also somewhat higher |
| Brazil IPCA | National consumer inflation | +4.58% over 12 months | Real loss of about 0.9% |
| São Paulo IPC-Fipe | Local cost of living | +3.60% over 12 months (July 2026) | Roughly break-even |
Are São Paulo home prices going up right now?
Yes. Prices are still edging up, and the monthly data show no sign of a citywide fall.
FipeZAP recorded a 0.52% rise in September 2026, after 0.37% in August, 0.36% in July, 0.08% in June, 0.22% in May, 0.19% in April and 0.42% in March. São Paulo has kept moving up even with expensive credit.
The pace is the real story. Prices are up 2.60% since January, from about R$11,900 per square meter at the end of 2025 to R$12,206 in September.
For a 70-square-meter apartment priced at the city average, that's over R$21,000 more in nine months.
Prices are going up, but this is not a fast-rising market.
Are São Paulo home prices beating inflation?
No, not really. They're roughly keeping pace, and whether you see a small gain or a small loss depends on the inflation index you use.
National inflation (IPCA) was 4.58% over the 12 months to September 2026. Against that, the 3.64% rise in asking prices is a real loss of about 0.9%.
São Paulo's own cost-of-living index, IPC-Fipe, was up 3.60% over the 12 months to July 2026, almost exactly the same as property prices.
An owner whose apartment went from R$1 million to about R$1.036 million gained around R$36,000 on paper. In purchasing power, they're about where they started.
In practice, São Paulo housing has held its value against inflation, not beaten it.
Is the São Paulo housing market losing momentum?
Yes. Price growth has slowed for two years in a row, even though prices are still rising.
FipeZAP recorded a 6.56% increase in São Paulo asking prices in 2024 and 4.56% in 2025. The latest 12-month figure is 3.64%.
The city is also lagging the rest of the country. Across the 56 cities in the FipeZAP index, prices rose 5.51% over the 12 months to September 2026, almost two points more than São Paulo.
Some markets are moving much faster: Vitória is up 11.93% and Vila Velha 14.76%. São Paulo is expensive, but it's now one of the slower large markets, not a hotspot.
| Period or market | Price growth |
|---|---|
| São Paulo, 2024 | +6.56% |
| São Paulo, 2025 | +4.56% |
| São Paulo, 12 months to September 2026 | +3.64% |
| FipeZAP 56-city average, 12 months to September 2026 | +5.51% |
| Vitória, 12 months to September 2026 | +11.93% |
| Vila Velha, 12 months to September 2026 | +14.76% |

Are buyers in São Paulo actually paying higher prices?
Yes, a little. Buyers are paying somewhat more for apartments than a year ago, but closed deals look calmer than the ads.
Flow Imóveis cleaned and analyzed the city's public ITBI transfer records, using the same capture window for each year. It found 5,113 apartment purchases in June 2026, the highest June total in a series going back to at least 2016.
The median apartment sold for R$445,000, against R$420,000 a year earlier, a 6% increase.
That overstates the real move, because the size and type of apartments sold changed. Per square meter, the median rose from R$4,841 to R$5,000, or 3.3%.
Volume needs the same adjustment. The raw number of sales was 9.6% higher, but June 2026 had an extra business day. Per business day, sales were up 4.6%.
So buyers are closing more deals and paying a bit more per square meter. What you don't see is buyers fighting over a shrinking supply of homes.
| São Paulo apartment transactions | June 2026 | June 2025 | Change |
|---|---|---|---|
| Apartments sold | 5,113 | 4,666 | +9.6% |
| Apartments sold per business day | 232.4 | 222.2 | +4.6% |
| Median sale price | R$445,000 | R$420,000 | +6.0% |
| Median price per m² | R$5,000 | R$4,841 | +3.3% |
Are expensive São Paulo neighborhoods all still going up?
No. The expensive neighborhoods are moving in very different directions, which makes the city average a poor guide for a specific purchase.
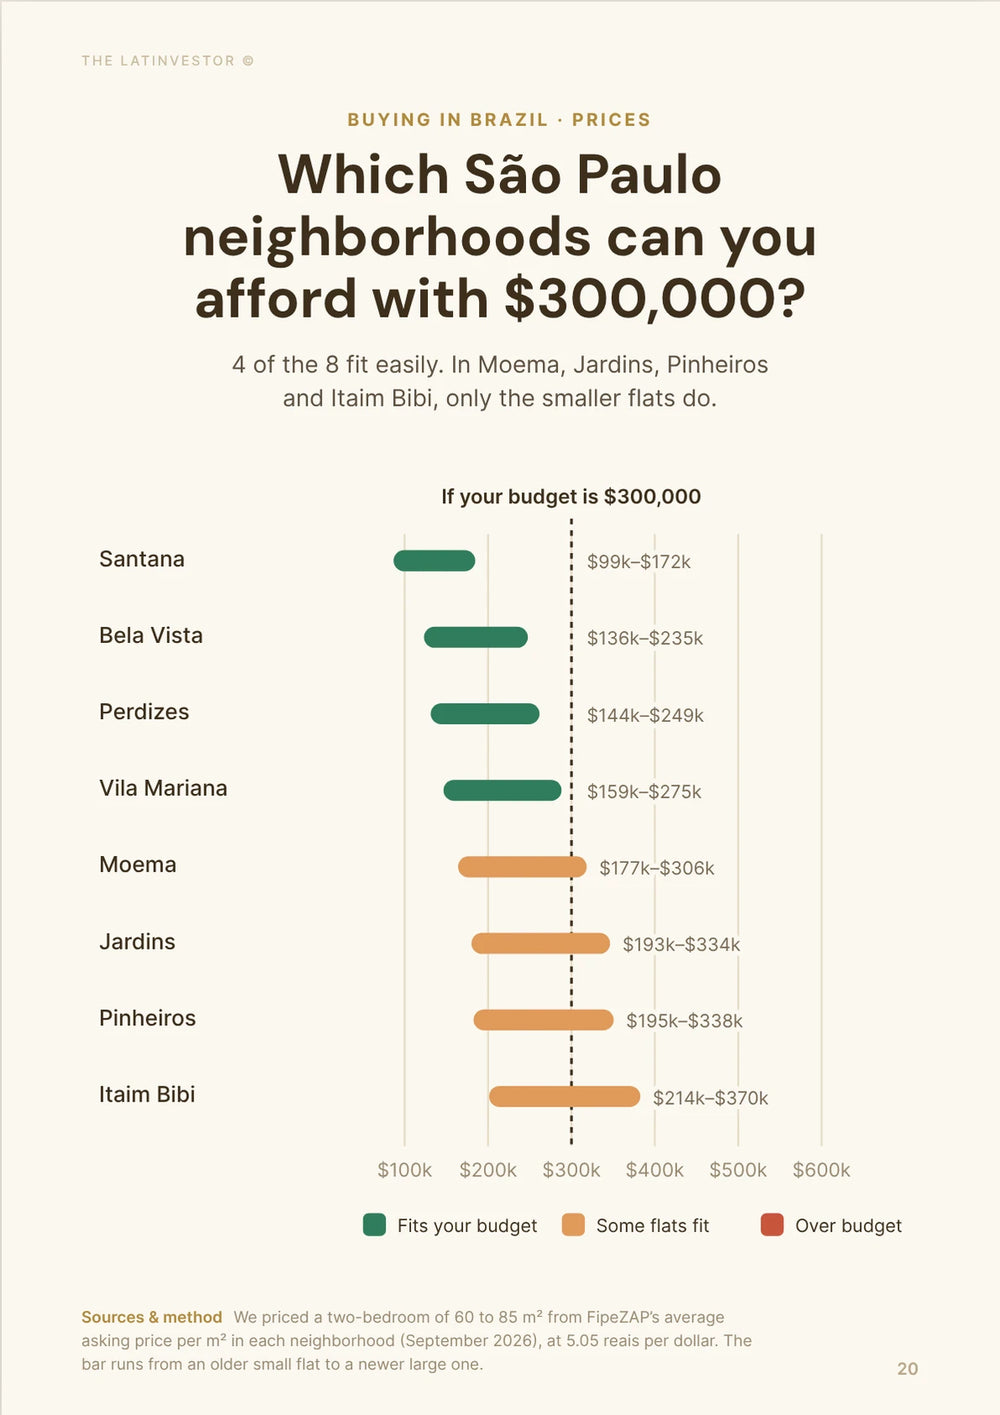
FipeZAP's September 2026 data show Jardins up 6.7% over 12 months (R$18,028 per square meter), Moema up 5.0% (R$16,520) and Perdizes up 4.0% (R$13,455). Itaim Bibi, the most expensive at R$19,989, is up 3.4%.
Pinheiros has stalled at -0.3%, despite an asking price of R$18,260 per square meter. Vila Mariana is up only 0.4%, at R$14,879.
Closed deals make the picture messier. In Flow Imóveis' June 2026 ITBI analysis, the median price per square meter fell 5.9% in Vila Mariana and 3.6% in Itaim Bibi, while Jardim Paulista rose 4.8% and Perdizes jumped 15.6%.
One-month district comparisons are noisy, because the homes sold change a lot from year to year. Still, the gap is too wide to ignore.
You can be right that "São Paulo prices are up" and still be buying in a neighborhood where recent deals closed lower than last year.
Is São Paulo building more apartments than buyers can absorb?
Yes. Developers are launching new apartments faster than they sell them, and unsold stock is piling up.
Secovi-SP counted 154,769 new homes launched in the city in the 12 months to August 2026, up 25%. Developers sold 121,064 over the same period, up about 10%.
That's a gap of almost 34,000 units in a year.
It shows in the stock: 98,018 new units were for sale in August 2026, 50.7% more than a year earlier. And while the number of units sold rose, their total value fell 4.4% over 12 months, a sign that sales are shifting toward smaller, cheaper homes.
Still, selling 121,000 new homes in a year doesn't mean buyers have disappeared. What it means is that developers have been very aggressive on supply, and as long as launches run ahead of sales, they have less room to push prices up.
Is Minha Casa, Minha Vida propping up São Paulo's new-home market?
Yes. Minha Casa, Minha Vida (MCMV) carries most of the new-home market, while mid- and high-end projects are struggling.
In August 2026, MCMV homes made up 77% of the units launched in the city and 71% of the units sold, according to Secovi-SP.
The split was already clear in the first half of 2026: MCMV launches rose 31% while mid- and upper-middle launches fell 28%. MCMV sales rose 17%; mid- and upper-market sales fell 22%, and their sales value fell 17%.
MCMV stock has grown too, to about 59,100 unsold units, but it sells in about 8 months at the current pace. Mid- and high-end stock now takes about 13 months to sell, against 7 in 2024.
So the new-build boom is mostly small, cheaper apartments backed by subsidized credit. Don't read it as strength for an unsubsidized R$1 million apartment.
| New-home trend, first half of 2026 | MCMV | Middle / upper segments |
|---|---|---|
| Change in launches | +31% | -28% |
| Change in unit sales | +17% | -22% |
| Change in sales value | +17% | -17% |
| Months of stock (August 2026) | About 8 | About 13 |
Can you negotiate a real discount on a new São Paulo apartment right now?
Yes, especially in the mid- and high-end segment, where 13 months of unsold stock puts buyers in a strong position.
FipeZAP's buyer survey for the second quarter of 2026 found an average discount of 9% on purchases, and 14% when the buyer actually negotiated one. In September 2026 alone, Guru dos Imóveis counted 1,398 São Paulo listings that cut their asking price. On a launch that has been selling slowly for months, a 10% to 15% discount is a realistic target, not an insult.
What to do: ask the sales stand how many units are still unsold and since when, compare with the original price list, and ask for the discount in writing, or for extras like a parking space, finishes or a cap on INCC indexation until delivery. Small, cheap units near metro stations are the exception: they sell fast, so expect little room there.
On an off-plan purchase, check that the project has a patrimônio de afetação (it ring-fences your money from the developer's other debts). Under Lei 13.786/2018, if you cancel, the developer can keep up to 25% of what you paid, or 50% with a patrimônio de afetação, and may deliver up to 180 days late without penalty.
Are high mortgage rates keeping São Paulo home prices down?
Yes. Expensive mortgages put a hard ceiling on what ordinary buyers can pay.
In September 2026, Banco Central data showed regulated housing loans at about 7.98% a year plus TR at Caixa, against 11.77% at Bradesco, 11.85% at Santander and 11.87% at Itaú.
That's before insurance, fees, condo charges and the cash needed for the down payment.
At São Paulo prices, it adds up fast. A 50-square-meter apartment at the city average costs about R$610,000 (about $121,000). Financing 80% means borrowing almost R$490,000.
Moving from Caixa's rate to a private bank's rate adds well over R$1,000 to the first monthly payment. For a household stretching to qualify, that's the difference between buying, choosing a smaller unit or staying in a rental.
Developers have responded by building smaller apartments and focusing on price bands that fit MCMV.
Until mortgage rates fall a lot, sellers can still raise their asking prices, but buyers can only follow so far. A foreign non-resident usually pays cash anyway, since Brazilian banks generally require residency, and that's real leverage in this market.
Are rents in São Paulo rising faster than home prices?
Yes. FipeZAP's rent index for São Paulo rose 6.22% in the 12 months to September 2026, against 3.64% for sale prices. The average asking rent is now R$65.78 per square meter a month.
People still need somewhere to live. When mortgages are too expensive, part of the demand that would have bought moves into renting, and that pushes rents up.
That's one reason a sharp fall in sale prices hasn't happened: underlying demand for housing is still strong, and landlords are getting their increases.
For investors, higher rents don't make every apartment a good buy. In a long-term lease the tenant usually pays the condo fee and IPTU, but vacancy, management and tax still eat into the gross rent. A non-resident landlord pays 15% withholding tax on the gross rent.
Could São Paulo home prices actually start falling now?
In some neighborhoods and segments, yes. Citywide, the evidence doesn't point to a broad fall in reais.
The pressure is real. Developers are building more than they sell, mid- and high-end new-home sales have dropped, mortgages are still expensive, and some pricey districts already show flat asking prices or lower closed-deal prices.
A citywide fall would need those weak spots to spread.
So far, transaction volumes are solid, rents keep rising and MCMV demand is absorbing a lot of units. Owners can also wait rather than accept a much lower price.
That's how a correction tends to look in São Paulo: prices get cheaper after inflation without big red numbers on the portals. Nominal prices barely move, and sellers quietly accept less at the negotiation stage instead of cutting the public asking price.
A sharper fall becomes likely if sales volumes drop while stock keeps rising and rents lose steam. We're not there yet.
Will the Selic cuts push São Paulo home prices up again?
Eventually, maybe, but the cuts so far haven't made mortgages cheap.
The Banco Central has brought the Selic down from 15% to 13.75%, with the last cut in September 2026. The market's Focus survey expects only 13.25% by the end of 2026, and the next Copom meeting is on November 3 and 4.
A 13.75% policy rate is still very tight, and mortgage rates don't drop every time the Selic falls a quarter point.
The interesting part comes later. São Paulo has gone through very expensive credit without a broad fall in nominal prices. If mortgage rates come down by several points, buyers who waited could come back to a market where many owners never cut their asking prices.
Before calling it a new boom, we'd want to see faster sales of non-MCMV apartments, more large homes selling, shrinking new-build stock and higher closed-deal prices, not just higher asking prices.
For now, cheaper credit is a likely next trigger, not something that has already changed the market.
So are home prices in São Paulo going up or down?
Up in reais, but slowly: about 3.64% a year. São Paulo is a slow, uneven market, not a boom.
Asking prices still point up, buyers are closing plenty of deals, and rents keep rising. There's no sign of a broad fall in nominal prices.
The picture weakens once you look underneath. Growth has slowed two years in a row. São Paulo is rising more slowly than the rest of Brazil. After inflation, the gain is around zero. Some major neighborhoods are flat or lower in closed deals. Developers are launching faster than buyers absorb, and most of the new-build strength comes from MCMV while mid- and high-end sales weaken.
So are São Paulo homes higher than a year ago? Yes.
Are they getting meaningfully more expensive in real terms? No.
Inflation, expensive mortgages and heavy new supply are keeping the rise in check. The biggest mistake would be to treat the city average as if every neighborhood and every type of apartment followed the same path, and the best move right now is to take your time and negotiate.
Our methodology
This article estimates whether São Paulo home prices are rising or falling, by looking at asking prices, closed deals, inflation, neighborhoods, new supply, credit and rents together rather than relying on one headline index.
Asking prices and rents come from FipeZAP (September 2026). Closed-deal prices come from the city's ITBI transfer records, as analyzed by Flow Imóveis for June 2026; we compare them per square meter and per business day so that changes in the mix of homes sold don't distort the result. Inflation comes from IBGE (IPCA) and Fipe (IPC-Fipe). New-home launches, sales and stock come from Secovi-SP's monthly survey (August 2026), mortgage rates and the Selic from the Banco Central do Brasil, and discounts from FipeZAP's buyer survey.
The rules mentioned (off-plan cancellations, withholding tax on rent for non-residents) come from Lei 13.786/2018 and the Receita Federal.
We checked these figures in October 2026. Conversions use about 5.05 reais per US dollar and 5.65 reais per euro.
Limits: FipeZAP tracks asking prices, not sale prices. One-month neighborhood comparisons from ITBI data are noisy, and we use them to show how uneven the market is, not as proof that a neighborhood has changed direction. Neighborhood figures are averages and say little about one specific building.
Key sources used for this analysis include FipeZAP sales index (September 2026), FipeZAP rental index (September 2026), FipeZAP methodology, FipeZAP Raio-X discount survey, Guru dos Imóveis, São Paulo's ITBI transaction database, the city government's explanation of the ITBI dataset, IBGE IPCA, IPC-Fipe (July 2026), Secovi-SP August 2026 survey (via Portas), Secovi-SP monthly market research, Secovi-SP first-half MCMV breakdown, Banco Central do Brasil mortgage rates, Ministry of Cities (Minha Casa, Minha Vida) and Lei 13.786/2018.