
Summary
Slowly up. Our base case for the next 12 months is 3% to 5% in reais, which would take São Paulo from R$12,206 to roughly R$12,600 to R$12,800 per square meter. After inflation, that's about flat.
Asking prices rose 3.64% in the year to September 2026, down from 4.56% at the end of 2025. September itself was a bit firmer, at +0.52% in one month.
Inflation was 4.58% over the same year, so São Paulo apartments lost about 0.9% in real terms, while the national FipeZAP index gained 5.51%.
Supply is the main pressure. Developers launched 154,769 homes in the 12 months to August 2026, while buyers took 121,064, and unsold stock jumped 50.7% in a year to 98,018 units.
Most of that is Minha Casa, Minha Vida: 77% of August launches and 60% of unsold stock. Units sold rose 10.2% over 12 months, but the money spent fell 4.4%, because the product is getting cheaper.
The middle of the market is where it hurts. Unsold mid- and high-end units now take about 13 months to sell, against 7 months in 2024.
Expensive credit hasn't stopped buyers. The Selic was cut to 13.75% in September 2026, and savings-funded mortgage lending in Brazil rose 37.5% from January to August, to R$132.5 billion.
Lower rates will help slowly. The Focus survey expects the Selic at 13.25% at the end of 2026 and 12% at the end of 2027, while consumer confidence fell for a fifth month in a row in September, to 84.2.
Developers can't cut list prices much: building costs (INCC) rose 6.66% in a year, almost twice as fast as resale prices. Expect incentives and smaller units, not a wave of price cuts.
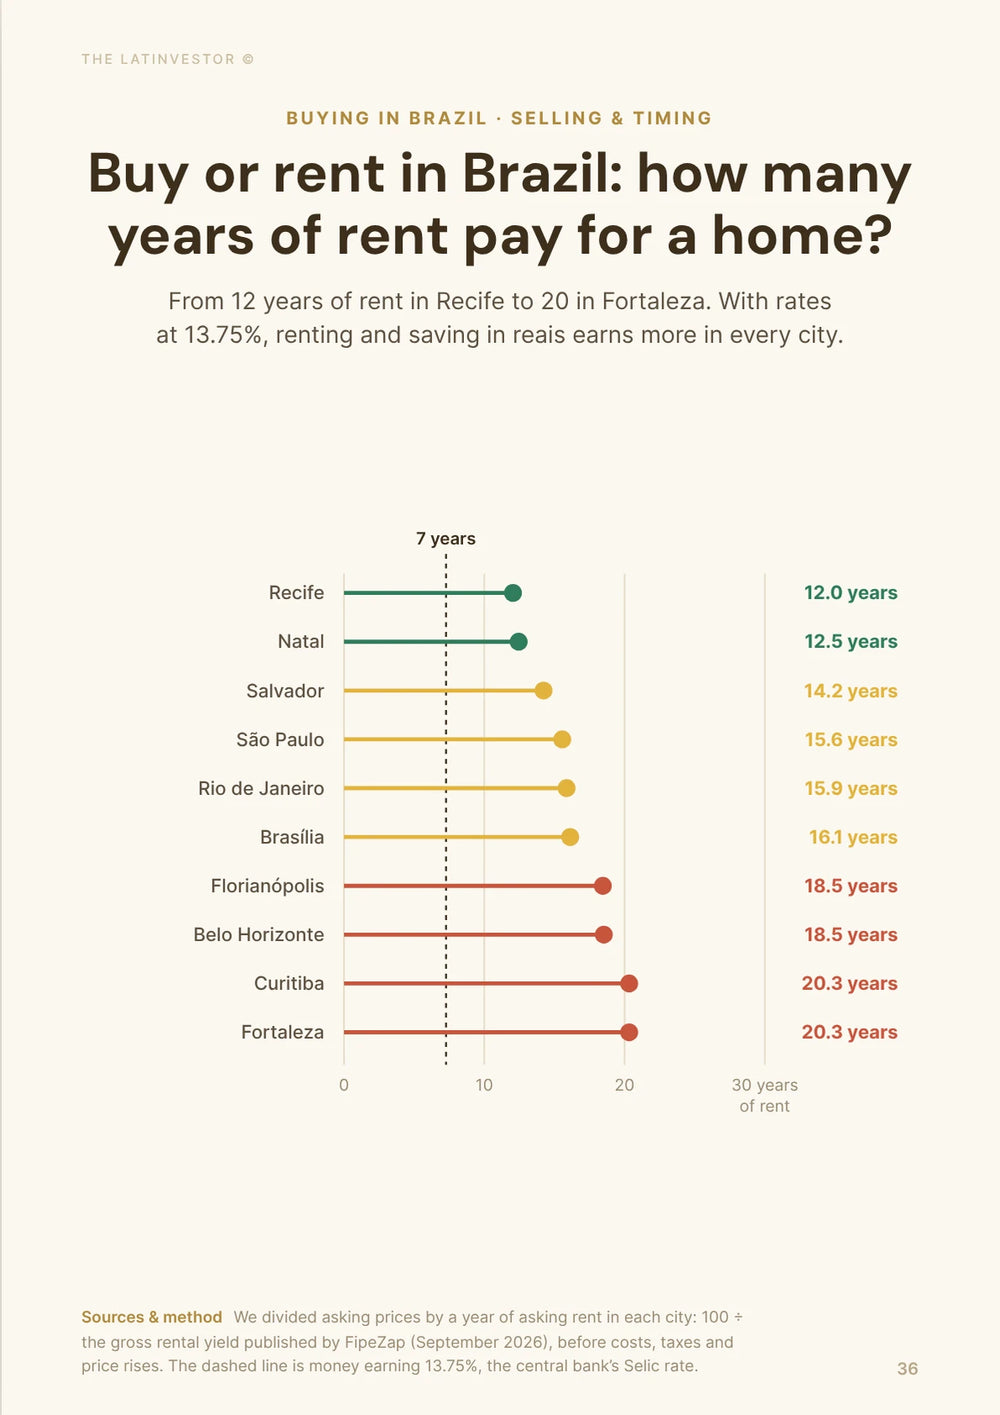
Rents keep rising faster than prices: +6.22% in a year, to R$65.78 per square meter, for a gross yield of about 6.4%.
The address matters more than the city: Jardins rose 6.7% and Moema 5%, while Pinheiros fell 0.3% and Vila Mariana rose only 0.4%.
The October 2026 runoff and the Copom meeting of 3-4 November are the next two events to watch. For a foreign buyer, the exchange rate can move the price in dollars more than a year of São Paulo appreciation.
A citywide crash isn't our scenario. The likely correction is quiet: small nominal gains, inflation and seller discounts (9% on average in Brazil) doing the work.
Bottom line: don't wait for a fall that the data doesn't show. Negotiate hard on the specific apartment, especially in the oversupplied middle segment, and count on rent for most of the return.


Are São Paulo home prices still going up?
Yes, but slowly. FipeZAP put the average asking price for ready apartments at R$12,206 per square meter (about USD 2,420) in September 2026, up 0.52% in the month and 3.64% over 12 months.
The annual pace slipped through most of 2026: 4.56% at the end of 2025, 3.81% in June and 3.60% in August, before a small pick-up in September. Prices are still setting nominal highs, just without much force.
São Paulo is also lagging the rest of the country. Across the 56 cities in the index, asking prices rose 5.51% in the same year, and cities like Salvador and Fortaleza rose more than 10%.
So buyers aren't walking into a falling market, but sellers can no longer assume any apartment will keep appreciating quickly.
| Month | Average São Paulo asking price | Monthly change | 12-month change |
|---|---|---|---|
| December 2025 | R$11,900/m² | +0.15% | +4.56% |
| June 2026 | R$12,055/m² | +0.08% | +3.81% |
| July 2026 | R$12,099/m² | +0.36% | +3.67% |
| August 2026 | R$12,143/m² | +0.37% | +3.60% |
| September 2026 | R$12,206/m² | +0.52% | +3.64% |
Are São Paulo homes actually getting more expensive after inflation?
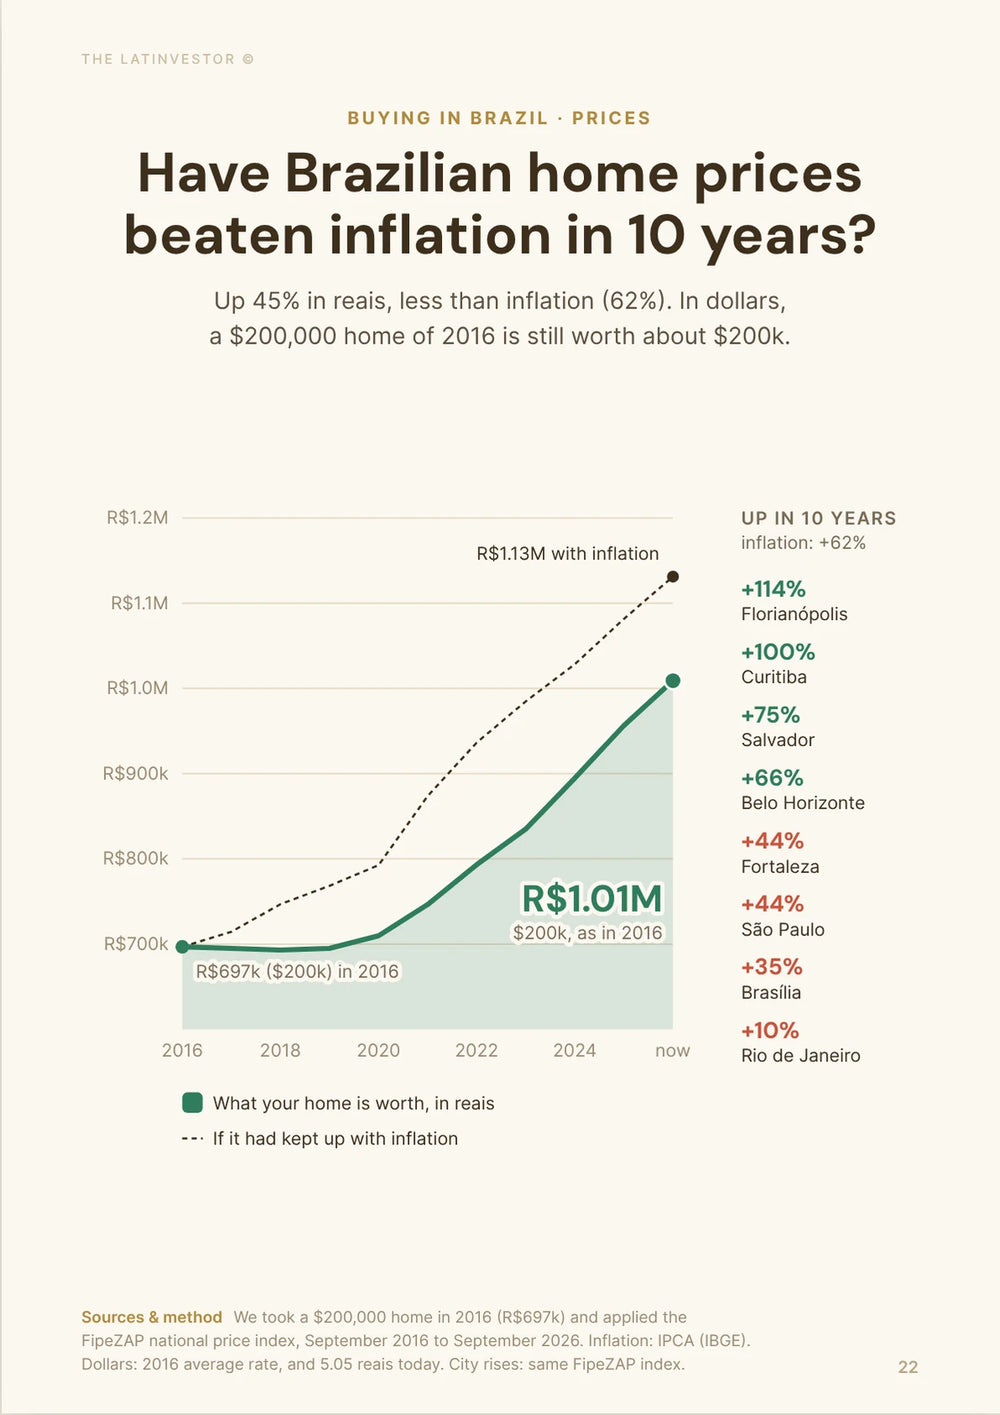
In reais, yes. In real terms, no: owners lost about 0.9% of purchasing power over the past year.
Asking prices rose 3.64% in the year to September 2026, while IPCA inflation was 4.58%. A R$1 million apartment (about USD 198,000) that rose 3.64% is now listed at about R$1,036,000, but everything else got 4.58% more expensive.
That's the defining feature of São Paulo housing right now: nominal prices look solid, real appreciation is slightly negative.
It can go on for a while. With the Focus survey expecting 4.30% inflation in 2027 and city prices rising 3% to 5%, owners would keep seeing higher asking prices without a real capital gain.
Is São Paulo building too many apartments?
Yes, and the unsold stock is now showing it. Secovi-SP counted 154,769 homes launched in the 12 months to August 2026, against 121,064 sold, so launches ran about 28% ahead of sales, a gap of about 33,700 units.
A one-year gap doesn't automatically mean a glut, because projects launch and deliver at different times. But this time the stock is piling up: 98,018 new units were for sale at the end of August 2026, 50.7% more than a year earlier.
About 60% of that stock (59,100 units) is Minha Casa, Minha Vida, which still sells in about 8 months at the current pace. The slow part is the rest: mid- and high-end stock now needs about 13 months to sell, against 7 months in 2024.
August alone shows the imbalance: 17,797 launches, more than double August 2025, against 10,813 sales.
| New-home indicator (Secovi-SP) | Latest reading |
|---|---|
| Launches, 12 months to August 2026 | 154,769 units (+25%) |
| Sales, 12 months to August 2026 | 121,064 units (+10.2%) |
| Launches above sales | ~33,700 units (~28%) |
| Unsold stock, August 2026 | 98,018 units (+50.7%) |
| Time to sell MCMV stock | ~8 months |
| Time to sell mid- and high-end stock | ~13 months (7 in 2024) |
Why are so many new São Paulo apartments cheap now?
Because expensive mortgages pushed demand down the price ladder, and developers followed it into Minha Casa, Minha Vida.
In August 2026, the program accounted for 77% of São Paulo launches and 71% of sales. In the first half of 2026, Secovi-SP reported MCMV launches up 31%, while middle and upper-middle launches fell 28%.
The clearest sign is in the money. Over 12 months, the number of units sold rose 10.2%, but the value sold fell 4.4%, to R$60.2 billion. More homes, cheaper homes.
Secovi-SP put the average MCMV price at around R$281,000 (about USD 55,600) in the first half of 2026. So when you read that São Paulo is building at record levels, remember that most of it is far below the price of the apartments foreign buyers look at in Pinheiros, Moema or Vila Mariana.
Are high mortgage rates finally hurting São Paulo home prices?
They're holding prices back, but they haven't broken them.
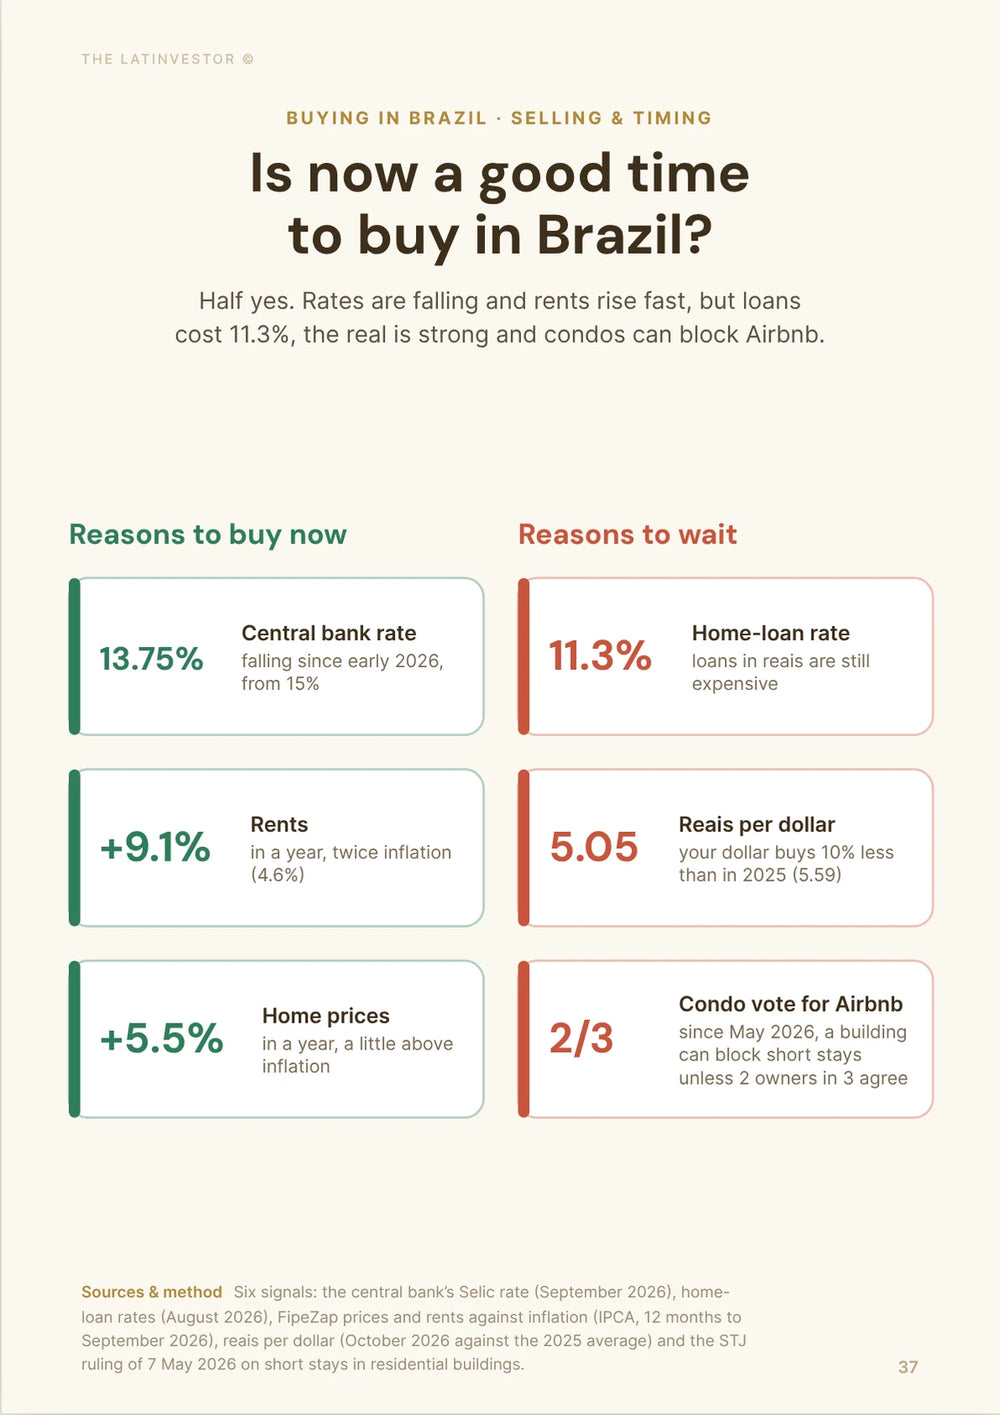
The Selic was cut from 14% to 13.75% in September 2026, which still leaves it about 9 points above inflation. In September, regulated housing loans cost about 7.98% a year plus TR at Caixa, and 11.77% to 11.87% plus TR at Bradesco, Santander and Itaú.
Yet lending is booming. Nationwide, ABECIP reported R$132.5 billion of savings-funded (SBPE) mortgages from January to August 2026, up 37.5% on a year earlier, covering 384,600 homes and renovations (+35.9%).
So credit is expensive but available. Buyers keep showing up; they just afford less apartment than they would with cheaper money. That's why prices slowed instead of cracking.
| Mortgage indicator | Latest reading | Change |
|---|---|---|
| Selic | 13.75% | Cut from 14% in September 2026 |
| Caixa housing loans | ~7.98% + TR | September 2026 |
| Big private banks | 11.77% to 11.87% + TR | September 2026 |
| SBPE lending, January to August 2026 | R$132.5bn | +37.5% YoY |
| Homes and renovations financed | 384,600 | +35.9% YoY |
Will falling interest rates push São Paulo home prices up again?
They'll help, but not enough for a new boom in the next year.
The easing cycle has started, from a very high level. The Focus survey of 19 October 2026 expects the Selic at 13.25% at the end of 2026 and 12% at the end of 2027. That still means expensive money.
Households are also getting more cautious. FGV's consumer confidence index fell for a fifth month in a row in September 2026, to 84.2 points, its lowest level since November 2022. Planned purchases of durable goods dropped the most, by 2.4 points.
So you have two forces pulling in opposite directions: credit slowly getting cheaper, and households less willing to commit. For prices to accelerate, mortgage rates would have to fall faster than developers add supply. We're not there.
Will the October 2026 election move São Paulo prices?
Not directly. The runoff is on 25 October 2026, and what matters for property is what comes after: the path of interest rates and of the real.
The next Copom meeting is on 3-4 November 2026. If the result scares markets, cuts can stall and mortgage demand cools again; if it reassures them, the Focus path toward 12% in 2027 gets more likely.
For a foreign buyer, the currency is the bigger lever. At 5.05 reais per dollar, R$1 million is about USD 198,000. The Focus survey of 19 October 2026 expects about 5.13 at the end of 2026 and 5.22 at the end of 2027, and a few cents either way changes your price in dollars more than a year of São Paulo appreciation.
What to do: don't rush to sign before the result, keep the price in reais, and plan your transfer separately from the purchase so you can pick the moment.
Are developers about to start cutting São Paulo apartment prices?
Not on the price list. Building costs are rising much faster than resale prices, so developers prefer incentives.
The INCC construction cost index rose 6.66% in the 12 months to September 2026, against 3.64% for São Paulo asking prices. That's a gap of about 3 points, squeezing developers between buyers who can't pay much more and costs that keep climbing.
They adjust in other ways first: smaller units, more MCMV, longer payment plans, paying the ITBI or notary fees, launch discounts, or delaying weaker projects.
That doesn't rule out real discounts on specific projects. With mid- and high-end stock taking 13 months to sell, a developer sitting on finished, unsold units has every reason to talk. A citywide wave of 15% or 20% official cuts is a different story, and unlikely with costs where they are.
| Cost or market measure | Latest 12-month change |
|---|---|
| São Paulo asking prices (FipeZAP) | +3.64% |
| INCC construction costs | +6.66% |
| Gap between costs and prices | ~3 percentage points |
| IPCA inflation | +4.58% |
Is it safe to buy off-plan in São Paulo right now?
It can be, but with unsold stock up 50.7% in a year, a ready unit a developer is struggling to sell is often the better deal.
Two things work against off-plan buyers today. The balance you owe is usually indexed to the INCC until you get the keys, so a 6.66% cost increase lands on your bill. And under Lei 13.786/2018, walking away can cost you up to 25% of what you paid, or up to 50% when the project has patrimônio de afetação.
What to do: compare the launch price per square meter with resale apartments in the same street, ask for the payment schedule with the INCC indexation spelled out, check whether the project has patrimônio de afetação, and ask the sales team about finished units still in stock. Those are where the discounts are.
Are São Paulo rents rising faster than home prices?
Yes. FipeZAP put average asking rent at R$65.78 per square meter in September 2026, up 6.22% in a year, against 3.64% for sale prices.
The increase isn't even. Perdizes (+8.1%), Paraíso (+7.9%) and Pinheiros (+6.5%) led, while Itaim Bibi rose only 1.2% and Vila Mariana slipped 0.9%.
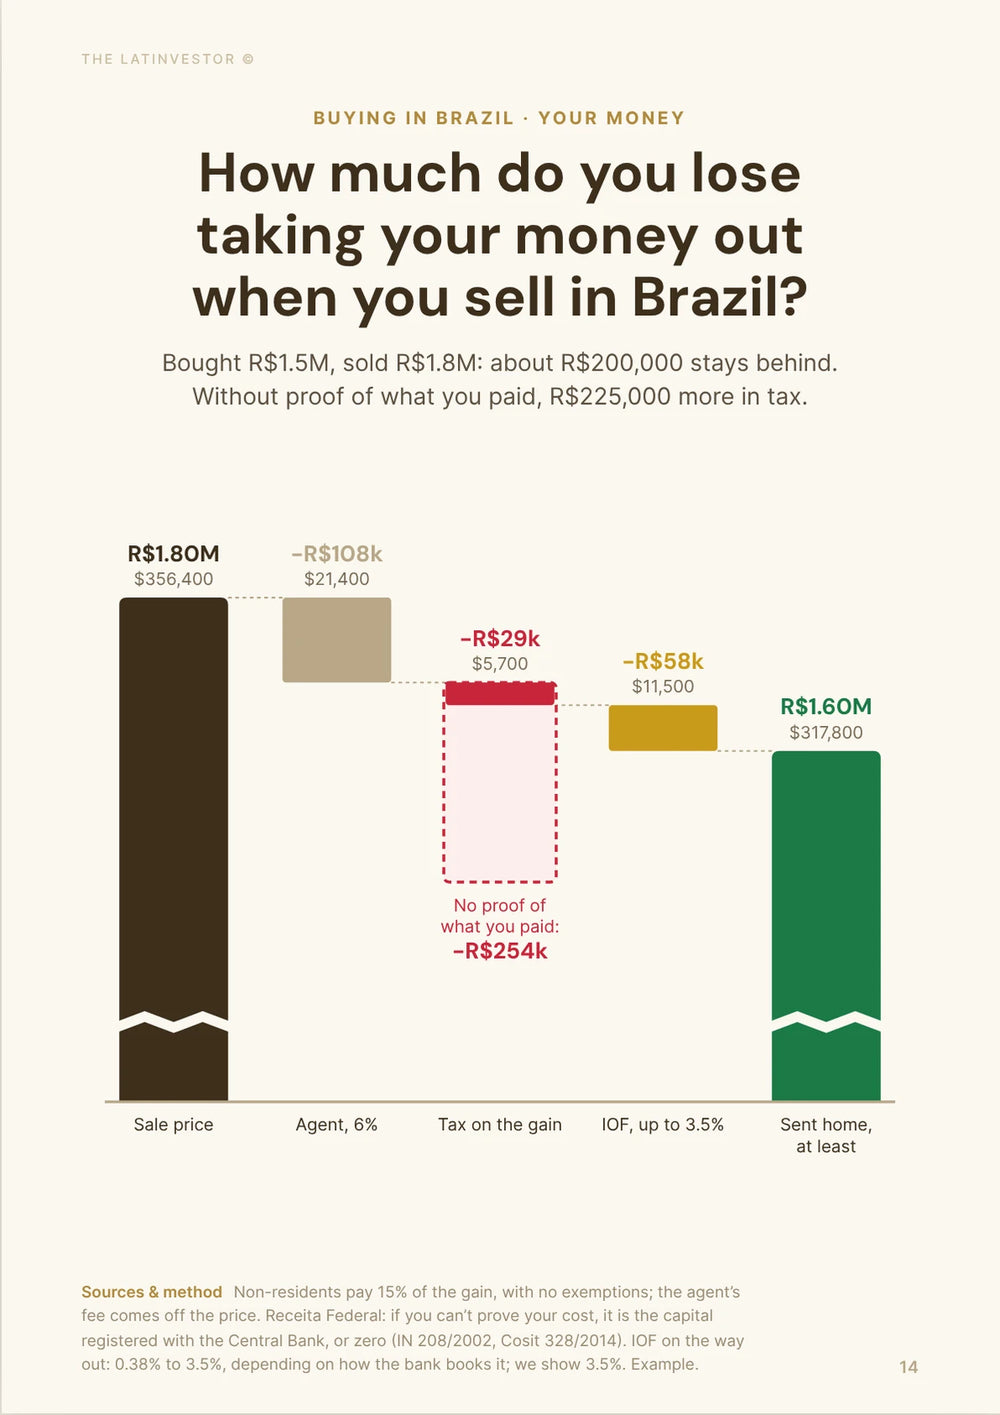
For investors, faster rent growth slowly lifts yields while prices barely move. Hasta's FipeZAP data puts the citywide gross yield at about 6.4%. If you live abroad, 15% of the gross rent is withheld as tax, which takes it to about 5.5% before vacancy, management and repairs. That still looks thin next to a 13.75% Selic, but the direction is right.
And for owners, strong rents are a way out: someone who can't get the price they want can rent the apartment instead of accepting a big discount.
| São Paulo rent measure (FipeZAP, September 2026) | Latest reading |
|---|---|
| Average asking rent | R$65.78/m² |
| 12-month rent increase | +6.22% |
| Perdizes | R$70/m² (+8.1%) |
| Pinheiros | R$100/m² (+6.5%) |
| Itaim Bibi | R$94/m² (+1.2%) |
| Sale-price growth for comparison | +3.64% |
Are expensive São Paulo neighborhoods still outperforming?
Some are, some have stalled, so a premium address no longer guarantees price growth.
In the year to September 2026, FipeZAP had Jardins up 6.7% and Moema up 5%. Itaim Bibi, the most expensive, rose 3.4%, close to the city average.
Pinheiros, still one of the priciest areas at R$18,260 per square meter, fell 0.3%. Vila Mariana rose only 0.4%. Further out, Santana rose 5.9%, from a much lower base.
The price range is wide: from under R$9,300 per square meter in Santana to almost R$20,000 in Itaim Bibi.
The next year should reward the specific apartment more than the postcode: a quiet street, a well-run building, sensible condo fees, a scarce family layout and a walk to the metro. An overpriced unit in a famous neighborhood can still disappoint.
| Neighborhood | Asking price (September 2026) | 12-month change |
|---|---|---|
| Itaim Bibi | R$19,989/m² | +3.4% |
| Pinheiros | R$18,260/m² | -0.3% |
| Jardins | R$18,028/m² | +6.7% |
| Moema | R$16,520/m² | +5.0% |
| Vila Mariana | R$14,879/m² | +0.4% |
| Perdizes | R$13,455/m² | +4.0% |
| Santana | R$9,288/m² | +5.9% |

Which São Paulo homes look most vulnerable now?
Generic middle-market apartments with lots of competing supply, more than subsidized housing or truly scarce prime homes.
The cheap end has MCMV behind it, and its stock still sells in about 8 months. At the top, wealthy buyers depend less on mortgages, and good locations have little land left.
The squeeze is in between. A household shopping for a R$800,000 to R$1.5 million apartment (about USD 158,000 to 297,000) is above the MCMV ceiling of R$600,000 but still needs a big mortgage at 11% to 12% plus TR at the private banks.
Developers see it too: mid- and high-end stock now takes about 13 months to sell, and middle and upper-middle launches fell 28% in the first half of 2026.
Not every middle-market home will struggle. The exposed ones are interchangeable: ordinary layouts, high condo fees, poor transport access and several similar new projects nearby. For those, a citywide index rising 3% or 4% says very little about what a real buyer will pay.
Could São Paulo home prices actually fall?
A broad nominal fall is possible but unlikely. Price cuts on individual apartments and weak real returns are much more likely.
The warning signs are there: high rates, falling consumer confidence and unsold stock up 50.7% in a year. But prices still inch up, rents rise 6.22% a year, and mortgage lending grew 37.5%.
Those supports would have to weaken together before a citywide fall became our main scenario. A recession that hits jobs, a new credit squeeze, or developers launching into rising stock for another year would change the picture.
Until then, inflation does the adjusting quietly. If an apartment stays at R$1 million for two years while inflation totals 8%, its owner has taken a real loss without the chart ever showing a crash. That's far more plausible for São Paulo than a sudden 15% or 20% drop.
Should buyers wait for São Paulo home prices to fall?
Not if you're waiting for a crash. The better move is to negotiate hard on a specific apartment now.
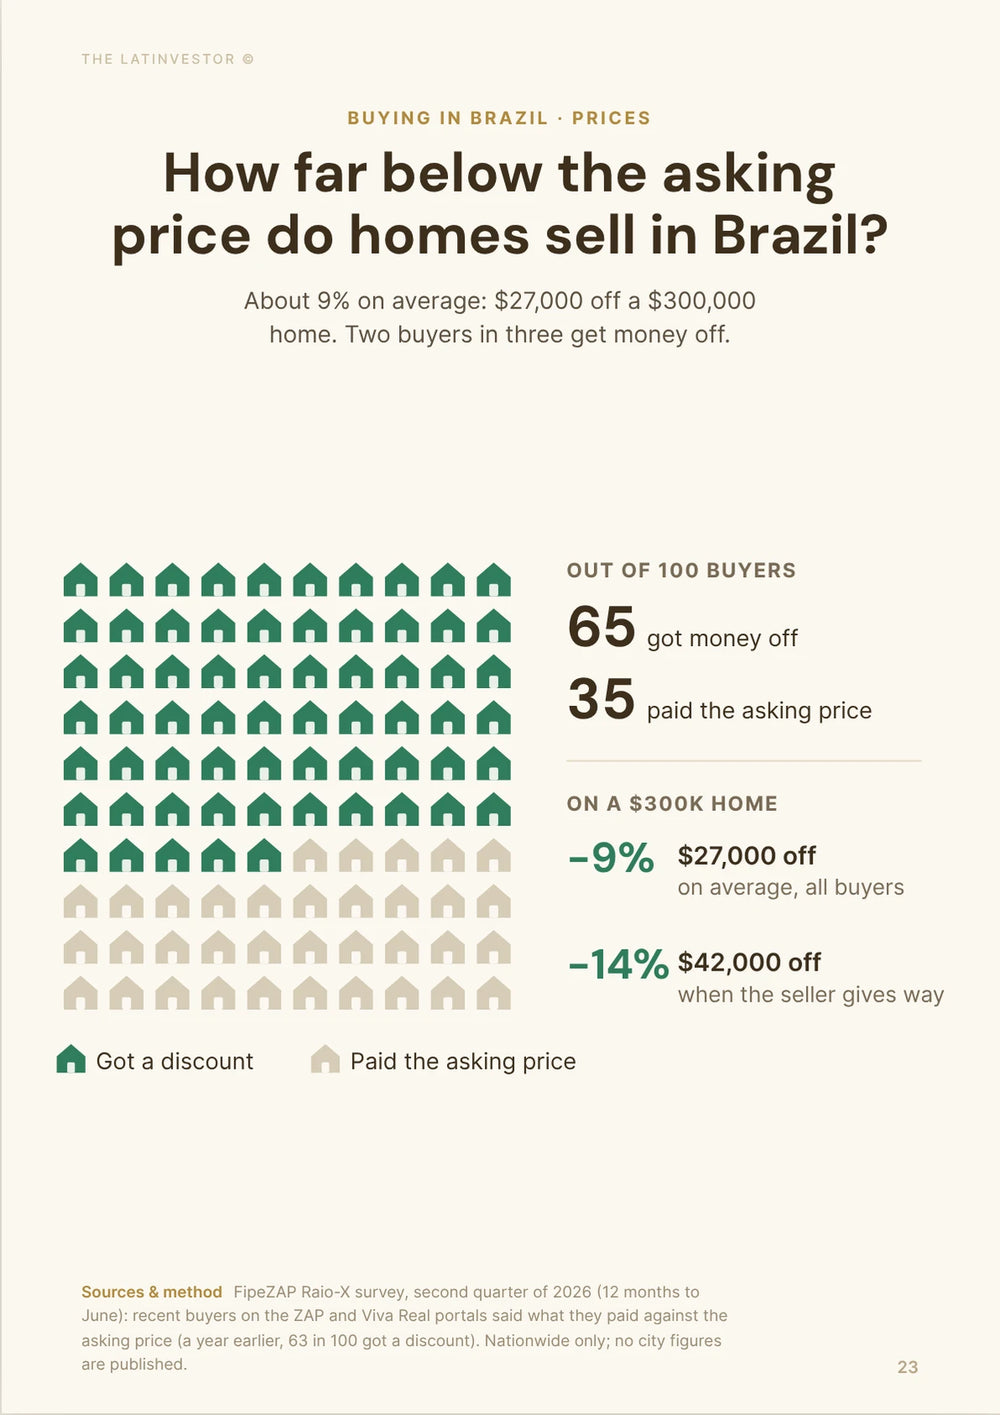
Discounts already happen below the smooth city average. In FipeZAP's Q2 2026 buyer survey, buyers across Brazil paid 9% below asking on average, and 14% among those who got a discount.
You also have choice: launches up 25% in a year, slower middle-market demand, finished units sitting with developers, and some expensive neighborhoods that barely moved in a year.
Waiting makes sense if you need a Brazilian mortgage and your numbers improve a lot with lower rates. If you live abroad, banks rarely lend to non-residents anyway, so rate cuts won't change much for you.
A good apartment bought 7% below an inflated asking price beats waiting two years for a 7% citywide fall that may never come.
Where are São Paulo home prices heading next?
Slowly higher. Our base case is 3% to 5% in reais over the next 12 months, roughly R$12,600 to R$12,800 per square meter (about USD 2,490 to 2,530).
That's in line with the data: Hasta's FipeZAP-based model projects 3.69% for the city, to about R$12,656, and buyers in FipeZAP's national survey expect 2.5%. It's a bit below our 4% to 6% base case for Brazil as a whole, because São Paulo has more supply to absorb.
With the Focus survey expecting 4.30% inflation in 2027, that range means anything from a real loss of about 1% to a real gain under 1%. Most owners will be standing still in real terms.
The city average will matter less and less. Good resale apartments in scarce locations can beat it, MCMV homes will keep selling in volume, and generic middle-market units facing heavy competing supply could need bigger discounts to move.
So São Paulo prices probably keep edging up, but the easy gains are gone. Choosing the right apartment, and the right price, matters more than simply owning one.
Our methodology
We estimated where São Paulo home prices are likely to go over the next 12 months, by looking at the forces that drive them: price momentum, inflation, new supply and unsold stock, the split between subsidized and regular housing, mortgage rates and volumes, building costs, rents, neighborhood gaps and household confidence.
Prices come from the FipeZAP sale index for September 2026 (city and neighborhoods) and rents from the FipeZAP rent index, with neighborhood rents via Hasta. FipeZAP tracks asking prices, not final sale prices, so we used the FipeZAP Raio-X survey for discounts. New-build launches, sales and stock come from Secovi-SP's monthly survey for August 2026.
Rates and mortgages come from the Banco Central do Brasil (Selic, bank mortgage rates, Focus survey) and ABECIP. Inflation is IBGE's IPCA, building costs are FGV's INCC, and confidence is FGV's consumer confidence index. Off-plan rules come from Lei 13.786/2018, and the 15% tax on non-residents' rent from Receita Federal.
Our 3% to 5% range is our own synthesis, not a model or someone else's forecast; we cross-checked it with Hasta's FipeZAP-based projection and the FipeZAP Raio-X buyer survey. It assumes no major economic shock after the October 2026 election.
We checked these figures in October 2026, using about 5.05 reais per US dollar and 5.65 reais per euro. Asking prices are not sale prices, neighborhood figures rest on fewer listings than city figures, and Secovi-SP counts new developments only, not resales.
Key sources used for this analysis include FipeZAP sale index (September 2026), FipeZAP rent index (September 2026), FipeZAP methodology, FipeZAP Raio-X, FipeZAP discount survey via Portas, Hasta (FipeZAP data and model for São Paulo), Secovi-SP monthly survey, Secovi-SP August 2026 data via Portas, Secovi-SP on MCMV and financing, Banco Central do Brasil (Selic), Banco Central do Brasil (mortgage rates), Focus survey of 19 October 2026 via SBT News, Focus survey of 19 October 2026 via InfoMoney, Banco Central Focus, ABECIP, IBGE IPCA, INCC (FGV) via Partnr, FGV consumer confidence (September 2026) via Jornal do Comércio and Lei 13.786/2018.